Chapter 6 - A revised formula for improving the child support scheme
This chapter brings together the key elements of the previous chapters to discuss how a revised child support formula might work, including how the formula would account for other dependent children. It also includes examples of how the amounts of child support payable might compare under that formula and the existing formula.
Submissions are invited on:
- whether all of the factors mentioned in this discussion (the expenditure for raising children, shared care and taking both parents’ income into account) should be included in a revised child support formula; and
- if all elements of the formula were not included, which one idea should be given priority.
6.1 Chapters 3, 4 and 5 outlined how the child support formula could be updated to better reflect a greater variety of circumstances and the expenditure for raising children in New Zealand. This chapter brings these various strands together. Before doing so, it considers some remaining issues: whether contributions should just cover basic costs or rise with income, whether there should be an income cap and whether the formula should reflect any differences in costs for raising children at different ages.
Should contributions just cover basic costs or rise with income?
6.2 Costs and the associated child support contributions need not be expressed as a percentage of income. The alternative approach would be to have a flat child-support payment to reflect the basic expenditure for raising a child.
6.3 There are arguments for and against this approach. Having a flat amount would simplify the administration of child support, including the administrative review process, as there would be fewer grounds for variation. Given the discussion thus far, the payment would, however, need to be adjusted to reflect how care of the children was shared between parents. The payment may also need to be apportioned between the two parents based on their share of total income.
6.4 A flat amount could result in higher child support payments for those on lower incomes, possibly more than they would pay in a two-parent family situation after allowing for tax benefits. Conversely, those on higher incomes would pay appreciably less, but could voluntarily pay more than the basic amount if they wished.
6.5 A flat amount may be appropriate when the child support recipient also received a sole parent benefit. This is because the benefit amount is fixed and there is generally no pass-on of the child support payments to the beneficiary.[33]
6.6 In other cases, the state’s role is to facilitate calculation of a child support amount and ensure that it is received by the other parent for the benefit of the child. In these cases a flat amount is not appropriate as children have a right to expect the amount to better reflect the income of their parents, as it would in the two-parent family.
6.7 A further reason for not having a flat payment is the research finding for New Zealand and elsewhere that expenditures on children increase, although at a declining rate, with income.[34] Higher income households generally have higher living standards and, all other things being equal, children tend to share in those living standards.[35] Consequently, other countries relate their child support payments to parental income and express the expenditure for raising children as a percentage of income.
6.8 Also, to the extent that children’s expectations about living standards are not fulfilled because only a flat amount of child support is paid, relief may be sought for additional payments through the administrative review process or the courts. This would increase the overall costs to parents and put more pressure on both the administrative review process and the court system.
6.9 Financially, a flat amount is unlikely to be an adequate benchmark for separated parents who might otherwise avoid the court process by using the formula as a starting point for reaching a voluntary agreement on their child support arrangements.
6.10 For the reasons discussed above, the expenditure for raising children should continue to be expressed as a percentage of income in New Zealand too.
Should there still be an income cap?
6.11 Australia recognises that, as household income levels rise far above the community average, it becomes increasingly difficult to measure further increases in expenditure on children. Spending becomes increasingly discretionary, so that costs tend to gradually flatten out.[36] Accordingly, an income cap for the purposes of calculating the payment was considered appropriate for Australia, at 2.5 times the total average earnings for a male. This equates currently to a child support income cap of A$147,135. As child support income is net of both parents’ living allowances, this means that in terms of taxable income the cap is equivalent to over A$180,000.
6.12 For the same reasons, an income cap seems appropriate for New Zealand. It is recognised that it is difficult to measure when expenditure might flatten out and that, although the cap would need to be appreciably above the average income, how much above is likely to be somewhat arbitrary. New Zealand currently has a cap which, like Australia’s, is 2.5 times the average income but it includes only the paying parent’s income and there is no adjustment for the New Zealand living allowance.
6.13 If both parents’ incomes were to be included in the child support liability calculation (see chapter 5), it would seem appropriate that the cap be raised to the same level as Australia’s – that is, effectively 3.17 times the total average earnings before deducting the two parents’ living allowances.[37]
6.14 A high-income paying parent who is a sole income earner could be disadvantaged by this change. However, there may be offsetting benefits from a child support percentage structure that progressively declines with each higher income bracket and that provides greater recognition of lower levels of regular and shared care.
Should the child’s age be taken into consideration?
6.15 Given the findings from the study of the expenditure for raising children that costs increase significantly for older children, the question arises whether payments should increase after the child reaches 12 years of age. Both Australian studies found that older children are more costly, even after factoring in additional childcare costs for younger children.
6.16 Taking age into consideration would further complicate the formula. Australia nevertheless decided that this complication was necessary given the extent of the variation in age groups.
6.17 A contribution calculation that did not take into account a child’s age could lead to material over- or under-payments, depending on how old the child was when child support was first paid and how long the child was in the scheme.
6.18 Accordingly, if the formula is to be amended to reflect the expenditure for raising children as suggested below, it is recommended that age should be taken into consideration, as in Australia, by having values based on two age categories: 0-12 years and over 12 years.
A possible revised formula – option 1 – comprehensive change
6.19 Having considered all of the relevant variables, the rest of this chapter brings these together in a revised formula. Under this formula, the three key initiatives would be:
- To deal with concerns about insufficient recognition of regular and shared care of children, the formula would incorporate lower levels of shared care. For the purposes of this chapter, this would be by way of tiered thresholds (see chapter 4). This would mean that the minimum regular care recognised would be 14 percent of nights (or its equivalent). Regular care of at least this level would remove the minimum annual child support contribution.
- To deal with concerns about the capacity to pay, both parents’ incomes would be included in the formula, with payments being apportioned according to each parent’s share of total income. For each parent, “income” would generally be defined as taxable income for Working for Families Tax Credit purposes, less a fixed living allowance set at one-third of the average earnings. If there were also dependent children, a parent’s income would be further reduced for the assumed expenditure for those children, before calculating their child support contribution.
- To deal with concerns about payments not being in line with the expenditure for raising children, the formula would use a new scale of income percentages that reflected up-to-date information on the net (of average tax benefits) expenditure for raising children in New Zealand. These percentages would vary with:
- the number of children;
- the age of the children (the percentage would be higher for children over 12 years); and
- the combined income of the parents.
| Parents’ combined child support income (income above the living allowance amounts) (1) | ||||||
| Number of children |
$0 – $24,081 (2) |
$24,082 – $48,162 (3) |
$48,163 – $72,243 (4) |
$72,244 – $96,324 (5) |
$96,325 – $120,405 (6) |
Over $120,405 (6) |
| Expenditure for raising children (to be apportioned between the parents) | ||||||
| Children aged 0–12 years | ||||||
| 1 child | 17c for each $1 | $4,094 plus 15c for each $1 over $24,081 |
$7,706 plus 12c for each $1 over $48,162 |
$10,596 plus 10c for each $1 over $72,243 |
$13,004 plus 7c for each $1 over $96,324 |
$14,689 |
| 2 children | 24c for each $1 | $5,779 plus 23c for each $1 over $24,081 |
$11,318 plus 20c for each $1 over $48,162 |
$16,134 plus 18c for each $1 over $72,243 |
$20,469 plus 10c for each $1 over $96,324 |
$22,877 |
| 3+ children | 27c for each $1 | $6,502 plus 26c for each $1 over $24,081 |
$12,763 plus 25c for each $1 over $48,162 |
$18,783 plus 24c for each $1 over $72,243 |
$24,563 plus 18c for each $1 over $96,324 |
$28,897 |
| Children aged 13+ years | ||||||
| 1 child | 23c for each $1 | $5,539 plus 22c for each $1 over $24,081 |
$10,836 plus 12c for each $1 over $48,162 |
$13,726 plus 10c for each $1 over $72,243 |
$16,134 plus 9c for each $1 over $96,324 |
$18,302 |
| 2 children | 29c for each $1 | $6,983 plus 28c for each $1 over $24,081 |
$13,726 plus 25c for each $1 over $48,162 |
$19,746 plus 20c for each $1 over $72,243 |
$24,563 plus 13c for each $1 over $96,324 |
$27,693 |
| 3+ children | 32c for each $1 | $7,706 plus 31c for each $1 over $24,081 |
$15,171 plus 30c for each $1 over $48,162 |
$22,395 plus 29c for each $1 over $72,243 |
$29,379 plus 20c for each $1 over $96,324 |
$34,195 |
| Children of mixed age* | ||||||
| 2 children | 26.5c for each $1 | $6,381 plus 25.5c for each $1 over $24,081 |
$12,522 plus 22.5c for each $1 over $48,162 |
$17,940 plus 19c for each $1 over $72,243 |
$22,515 plus 11.5c for each $1 over $96,324 |
$25,285 |
| 3+ children | 29.5c for each $1 | $7,104 plus 28.5c for each $1 over $24,081 |
$13,967 plus 27.5c for each $1 over $48,162 |
$20,589 plus 26.5c for each $1 over $72,243 |
$26,971 plus 19c for each $1 over $96,324 |
$31,546 |
(1) Calculated by adding the two parents’ child support incomes, that is, adding each parent’s adjusted taxable income minus their living allowance of $16,054 (1/3 of Average Weekly Earnings (AWE)).
(2) .5 of AWE.
(3) AWE.
(4) 1.5 times AWE.
(5) 2 times AWE.
(6) 2.5 times AWE. Expenditure for raising children does not increase above this cap. Note that this equates to a cap at a combined adjusted taxable income of $152,514.
* The rates are the average of the two previous age categories.
How this approach would work in practice
6.20 Under this new formula each parent would be allocated a standard living allowance which would be deducted from his or her respective taxable income.[38] The two net amounts would be summed up and expressed as a percentage of the total. These proportions would then be applied to the expenditure for raising children amount relevant for that child so the expenditure for raising the child or children is split between the two parents based on their relative net incomes.
6.21 Each parent’s percentage of shared care would then be deducted from the result to produce a net liability for one of the parents. This would be the parent whose shared-care percentage is less than his or her share of total net income.
6.22 These steps are illustrated in the following example.
Example 1: How the formula would take into account income and shared care
Situation A
Parents Kenny and Clara, who are living apart, have two children, aged 15 and 10.
Kenny’s taxable income is $50,000 while Clara’s is $15,000.
Kenny and Clara would each be entitled to a fixed living allowance of $16,054 reducing their respective incomes to $33,946 and $0, a combined child support income of $33,946.
Kenny’s proportion of child support income would therefore be 100 percent while Clara’s would be 0 percent. Clara is the sole caregiver so there is no shared care adjustment.
In accordance with Table 10, the relevant expenditure for the two children of mixed ages is $8,897.
Clara has no liability and Kenny must pay $8,897 to help support the children.
Situation B
Kenny’s taxable income is $50,000 while Clara’s is now $25,000.
Kenny and Clara would again each be allowed a fixed living allowance of $16,054 reducing their respective incomes to $33,946 and $8,946, a combined child support income of $42,892.
Kenny’s proportion of child support income would therefore be 79.14 percent while Clara’s would be 20.86 percent. Clara is still the sole caregiver so there is no shared care adjustment.
In accordance with Table 10, the relevant expenditure for the two children of mixed ages is $11,178.
Accordingly, Kenny must pay $8,847 to help support the children.
Situation C
This is the same as situation B except that Kenny now also shares some of the care, having the children every other weekend or one-seventh (14%) of nights.
If the compromise table for shared care (noted in Table 9) was used, Kenny would be considered to incur 14 percent of the expenditure for raising the children. Kenny’s share of the $11,178 expenditure would be 79.14 percent less the amount (14 percent) he is assumed to have already paid out by caring for the children, a net amount of 65.14 percent, meaning that Kenny must pay $7,282 to help support the children. Clara would have no liability as her share of care (86 percent) would be more than her proportion of total child support income (20.86 percent).
Alternatively, if shared care was based on a minimum 33 percent of nights, there would be no shared care adjustment and the outcome would be the same as under situation B.
Comparison with current formula
In all of situations A, B and C, under the existing formula Kenny would have to pay $8,602 (based on not living with a partner and no other dependent children living with Kenny).
Treatment of other dependent children and new partners
6.23 Under this revised formula, adjustments would be made to take into account the expenditure for raising other dependent children. For this purpose, other dependent children would be treated the same way as children subject to child support. To recognise the care a parent provides for dependent children, an amount (in addition to the living allowance) would be deducted from the parent’s adjusted taxable income before applying the basic formula.
6.24 The parent’s care and cost percentages would be worked out for the relevant dependent child. For the purposes of calculating the expenditure for raising the child, the income of one parent only would be used. The expenditure for raising the child would be multiplied by the cost proportion. This would be the relevant dependent child amount, which would be deducted from the parent’s taxable income, along with the living allowance, to determine their child support income. The basic new formula would then be applied to work out the level of payments for the children receiving child support.
6.25 The income of a new partner would not be taken into account in these calculations. In some cases, the new partner in effect becomes a parent, while in others parenting may remain primarily with the separated parents. It is not possible to reflect this variance in a formula, particularly if the new partner also has personal child support liabilities. The administrative review process would, however, continue to be available to parents who consider that the other parent’s new partner’s circumstances should be taken into account.
Example 2: How the formula would take into account other dependent children
Stella pays child support for her daughter Belle, 17. She has two dependent children in her new family, Mick, aged 13 and Ailsa, aged 8. Mick and Ailsa live with Stella. Stella’s income needs to be adjusted to reflect the two dependent children in her current relationship before calculating her contribution towards Belle’s child support.
Stella’s taxable income of $50,000 is first reduced by the living allowance of $16,054, giving $33,946.
Stella’s percentage of care for Mick and Ailsa is 100 percent. This means that her cost percentage for these two children is 100 percent – in other words, she is assumed to incur all of the costs associated with raising these children.
The expenditure for the dependent children is worked out using Stella’s child support income only (see the mixed age category in Table 10). On an income of $33,946 the total expenditure for raising Mick and Ailsa is $8,897 with each child costing $4,449.
Each child’s cost is multiplied by the parent’s cost percentage for the child – in this case 100%.
Stella’s income of $50,000 is therefore reduced by both the living allowance of $16,054 and the $8,897 leaving an amount of $25,049 to be used as her child support income for the purposes of calculating her child support contribution for Belle.
6.26 Further examples are provided in appendix 5.
Comparison of contributions under the old and new formulas
When a parent is the sole income earner and does not share care
6.27 Figures 6 to 9 illustrate the impact of revised child support payments under a possible compromise formula as a percentage of different income levels. They do not factor in changes that could arise from including both parents’ incomes or from taking into account instances of regular parental care. They are for the very specific situation when the paying parent is the sole income earner, has no dependent children and does not share care with the receiving parent. The estimated costs are after adjusting for tax benefits.
6.28 The greatest difference is in relation to a single child up to 12 years of age. The current formula appears to result in over-payments whereas the suggested new formula is very close to the estimated net cost. In part this is the result of the current formula using the same child support percentage irrespective of income, whereas it is envisaged that the new formula would, as discussed earlier in this chapter, use a scale of declining rates to reflect the declining proportion of income spent on children as income rises.
6.29 Conversely, the payments under the current formula for a child aged 13 years or over tend to be less than the net cost. Again, the new formula is close to the net costs. Figures 6 to 9 illustrate the merits of distinguishing between the two age bands.
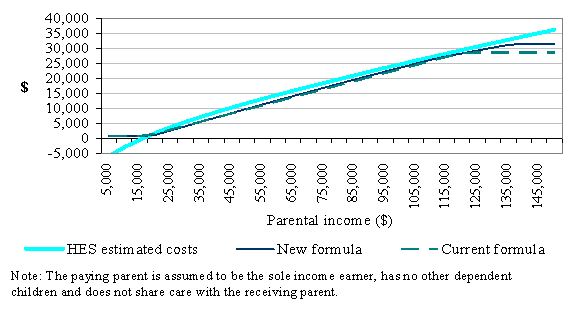
6.30 The differences between the two formulas are far less for two and three children.
6.31 In all four cases the payments diverge from the estimated net expenditure for raising children once the income cap applies. The income cap would cut in, however, at a higher level than under the current formula, reducing the range of divergence.
Figure 6: Payments for a single child, up to 12 years
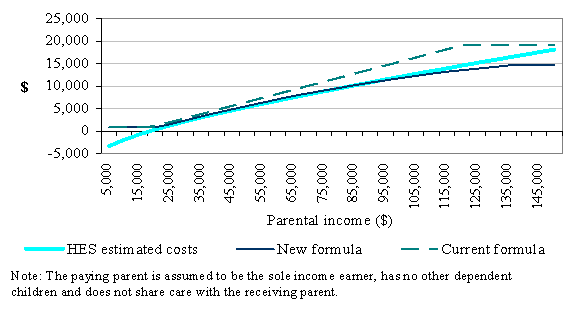
Figure 7: Payments for a single child, 13 years or older
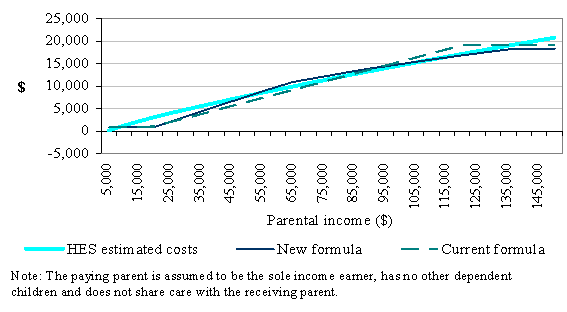
Figure 8: Payments for two children
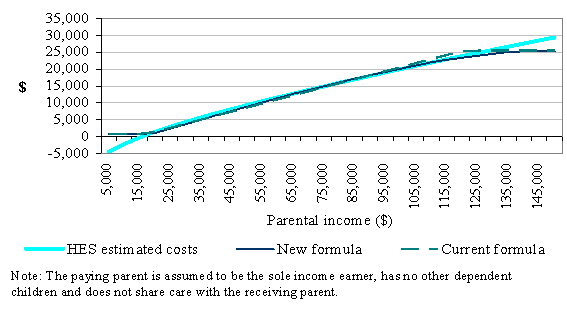
Figure 9: Payments for three children
Effect of potential changes taking into account both parents’ incomes and shared care
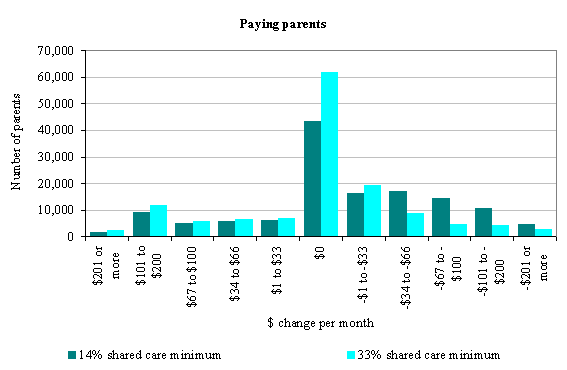
6.32 Figure 10 factors in the suggested changes that would arise from including both parents’ incomes and recognising a wider range of regular parental care, as well as the estimated expenditure for raising children in New Zealand. In terms of shared care, two scenarios are shown. The first recognises shared care as low as 14 percent of nights (referred to earlier as the compromise example) and the second recognises shared care on the same tiered basis but only from when parental care is at least 33 percent.
6.33 A main finding shown in the charts in Figure 10 is that, for a large portion of both receiving and paying parents, the changes would not result in any change in the amounts parents received or paid. This reflects the fact that many parents will continue to either receive a sole-parent benefit (and therefore do not receive child support payments directly) or continue to pay the minimum contribution because their income level is below the minimum level for child support purposes.
6.34 In particular, it should be noted that, for many receiving parents, a reduction in the child support contribution from the paying parent will not result in any decrease in the amount of benefit that they receive.
6.35 Of those remaining parents whose child support will be affected, the change in child support receipts or payments for the majority is likely to be between plus or minus $66 per month (plus or minus $800 per year). Figure 10 indicates that over 80 percent of current child support receipts and around 70 percent of payments would either be unaffected or affected to the extent of plus or minus $66 per month.
6.36 Parents who would qualify for any wider recognition of shared care would be most affected, with paying parents likely to pay less in such cases. Consequently, how and the extent to which regular care is recognised is important to the overall outcome. This is graphically illustrated in the differences between the outcomes of shared care commencing from 14 percent compared with commencing from 33 percent. Under a minimum of 33 percent care, there are just as many receiving parents who would receive more than would receive less, and the impact on paying parents is correspondingly less.
6.37 The recognition of both parents’ incomes would generally have less of a financial impact unless the receiving parent earns around $40,000 or more.
6.38 The above impacts may be reduced as in some cases changes in the amount of child support received or paid affects (in the opposite direction) the amount of Working for Families Tax Credits received.
Alternative option – option 2 – component changes
6.39 An alternative option would be to incorporate just one or two of the key changes. The existing formula could be extended to include recognition of a wider range of regular care situations, just the up-to-date expenditure for raising children in New Zealand, just both parents’ incomes, or a combination of some of these. This approach would likely reduce the overall impact of any change. It would, however, be a less comprehensive and transparent solution.
6.40 Any change could have a material impact for a minority of parents. Nevertheless, the overall question to bear in mind is whether any particular change would achieve a fairer outcome that would encourage more parents to pay their outstanding child support liabilities voluntarily.
Figure 10: Estimated monthly change in child support receipts and payments
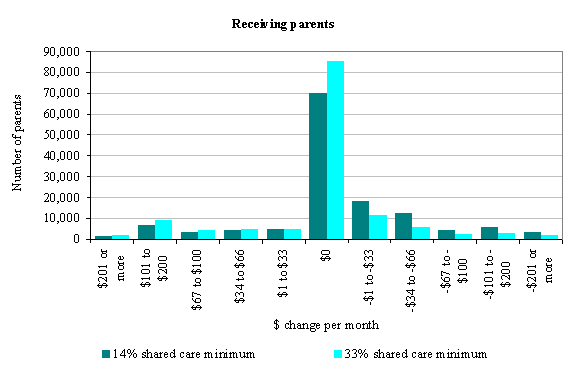
Notes:
The estimates are based on current child support relationships – that is, where someone is currently paying child support. The number of receiving parents includes parents receiving the sole-parent domestic purpose benefit. For parents entitled to the domestic purpose benefit there is no impact unless payments currently exceed the benefit because the child support payments are not directly passed on and are instead retained by the Crown. They have, however, been included to show a complete picture.
The number of paying parents exceeds the number of receiving parents because of children who are cared for by a third person. Taxable income information for the year ended March 2008 is used for both parents. No net amount is calculated for parents with multiple child support relationships and for parents who cross-apply for shared care arrangements.
The receiving parent’s child support income is slightly overstated in some cases because information is not available on how many dependent children they might have.
The age composition of the paying parent’s other dependent children is unknown and randomly assigned; it is unknown whether this results in an over- or under-estimation of the projected child support payments.
33 Pass-on is discussed in chapter 9.
34 One Australian study suggests that a reason why higher income Australian families spend a lower proportion of their gross income on children is because they pay more tax than lower income families. Consequently, spending on children as a percentage of after-tax income would likely be much closer across the income scale. See AMP.NATSEM Income and Wealth Report Issue 18, December 2007 by Richard Percival, Alicia.
35 These studies tend to be based on two-parent family situations. Consequently, when parents live apart and care of the child is shared there is generally less income available to spend on the children relative to the two-parent situation. This makes the continuity of expenditure principle harder to achieve in practice unless parental income is high.
36 Data from the Families Commission’s survey also showed an appreciable fall-off in the percentage of income put towards child support payments as higher income rises, although the sample size was small.
37 This equates to 2.5 times the total average earnings for a male: 3.17 – 2(0.333) = 2.5, with the living allowance being a third (0.33) of the male total average earnings.
38 If the net amount was negative then it would be treated as zero.