Annex: Calculation of debt-equity ratios
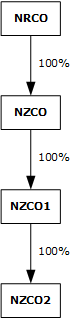
This example assumes that the broad and effective thin-capitalisation regime outlined is applied The structure to which the regime applies is as follows where NRCO is a non-resident company:
(Full size | SVG source)
NZCO, NZCO1 and NZCO2 have the following balance sheets as at 31 December 1994:
| NZCO | |||
| Assets | $ | Liabilities | $ |
| Investment in NZCO1 | 100 | Debt | 100 |
| Plant etc. | 100 | Equity | 100 |
| 200 | 200 | ||
| NZCO1 | |||
| Assets | $ | Liabilities | $ |
| Investment in NZCO2 | 100 | Debt | 100 |
| Plant etc. | 100 | Equity (NZCO1) | 100 |
| 200 | 200 | ||
| NZCO2 | |||
| Assets | $ | Liabilities | $ |
| Plant etc. | 200 | Debt | 100 |
| Equity (NZCO2) | 100 | ||
| 200 | 200 | ||
From the individual balance sheets, it would appear that all three companies have a debt:equity ratio of 1:1. However, in substance $400 is being invested in plant, which is being funded by $300 of debt. This is recognised on a consolidated accounting basis, where the debt:equity ratio of the corporate group consisting of NZCO, NZCO1 and NZCO2 is 3:1.
Consolidated Balance Sheet of NZCO and Subsidiaries as at 31 December 1994
| Assets | $ | Liabilities | $ |
| Plant etc. | 400 | Debt | 300 |
| Equity | 100 | ||
| 400 | 400 |
If the safe-harbour debt:equity ratio was set at 3:1, NZCO, NZCO1 and NZCO2 would not be denied an interest deduction. If the safe-harbour ratio was set at 2:1 NZCO, NZCO1 and NZCO2 would be subject to the proposed regime. This would mean a portion of their interest expense would be denied.
Conversely, under a non-consolidated approach, a chain of companies, where each company borrows from its parent, could result in each company breaching the proposed safe-harbour debt:equity ratio, even though the corporate group as a whole would not do so.
For example, consider again the example of NRCO, NZCO, NZCO1 and NZCO2. NZCO, NZCO1 and NZCO2 have the following balance sheets as at 31 December 1994:
| NZCO | |||
| Assets | $ | Liabilities | $ |
| Inter-Co Advance. | 300 | Debt | 300 |
| Plant etc. | 100 | Equity | 100 |
| 400 | 400 | ||
| NZCO1 | |||
| Assets | $ | Liabilities | $ |
| Inter-Co Advance | 300 | Debt | 300 |
| Plant etc. | 100 | Equity | 100 |
| 400 | 400 | ||
| NZCO2 | |||
| Assets | $ | Liabilities | $ |
| Plant etc. | 400 | Debt | 300 |
| Equity | 100 | ||
| 400 | 400 | ||
The debt:equity ratios of NZCO, NZCO1 and NZCO2 are 3:1 and so would be within a 3;1 safe-harbour ratio but would breach a 2:1 safe-harbour ratio.
However, on an consolidated basis, NZCO and its subsidiaries have a debt:equity ratio of 1:1 and so would be within a safe-harbour ratio of either 2:1 or 3:1.
Consolidated Balance Sheet of NZCO and Subsidiaries as at 31 December 1994
| Assets | $ | Liabilities | $ |
|---|---|---|---|
| Plant etc. | 600 | Debt | 300 |
| Equity | 300 | ||
| 600 | 600 |